


As cryptocurrency investors await the Fed’s decision, inflows into Bitcoin and Ethereum reach a one-year low. Bitcoin Sees $120,000
Inflows into the Bitcoin and Ethereum exchanges have fallen to a one-year low, suggesting that investors are reluctant to sell their holdings in anticipation of a possible rate decrease by the US Federal Reserve.
According to the most recent CryptoQuant Market analysis, stablecoin deposits—especially USDT—have increased significantly in the wake of the Fed’s statement, indicating that investors are accumulating dry powder for possible purchasing chances.
According to on-chain data, exchange inflows have significantly decreased from 51K BTC in July to a 7-day moving average of 25K BTC, the lowest amount in more than a year.

Bitcoin & Ethereum Inflows Crash 50% As Largest Holders Stop Selling
As a sign of less sell pressure from larger holders, the average Bitcoin deposit per transaction has also decreased, halving from 1.14 BTC in mid-July to 0.57 BTC in September.
This pattern is reflected in Ethereum inflows into exchanges, which are currently at a two-month low after reaching 1.8 million ETH on August 15 and a 7-day average of 783K ETH.
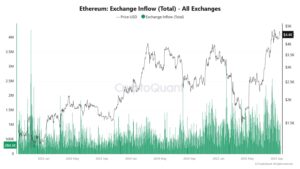
The average ETH deposit size has similarly declined from 40–45 ETH per transaction at previous peaks to just 30 ETH today, reflecting the same low sell-side activity observed in BTC.
Stablecoin net deposits, especially for USDT, have increased, hitting $379 million on August 31—the biggest amount this year—according to Julio Moreno, head of research at CryptoQuant.
Ahead of the Fed meeting, Moreno also disclosed that the Bitcoin Bull Score has changed from “bearish” to “neutral.”
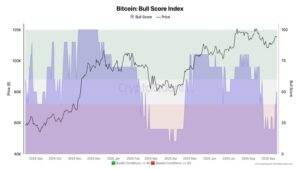
Over the last four days, the index has increased from 20 to 50.
Bitcoin has recovered to $115,000 after plunging to about $108,000 two weeks ago.
One significant component in this recovery is the movement of coins to and from exchanges.
As a basic principle, outflows suggest purchasing pressure (coins leaving exchanges), while inflows indicate selling pressure (coins going onto exchanges).
All that Binance has seen in the last nine days are outflows.
This pattern seems to have played a significant role in Bitcoin’s recent increase from $108k to $116k.
Given that today is the FOMC meeting, the pattern is emerging at a critical moment.
Most analysts, including BitMEX Co-founder Arthur Hayes, expect the Fed to decrease rates, with prediction markets like Polymarket suggesting
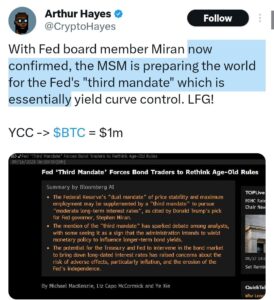
Investors’ early positioning ahead of this event is also shown in the regular outflows from Binance, which is supporting the bull case for Bitcoin to eventually overcome the psychological resistance of $120,000.
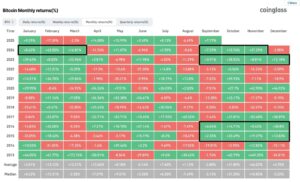
Bitcoin is currently reporting its greatest September results in thirteen years.
Historically, whenever Bitcoin has closed September in green, October and November have been extremely bullish, with an average combined gain of 35%.
Technical Analysis: Bitcoin Lower Channel Breakout Targets $128K-$132K
Bitcoin only needs one daily close and a successful post-reclaim retest of about $1117,200, according to cryptocurrency analyst Rekt Capital, in order to confirm a return into the blue daily range at $120,000 and start a new leg of the bull run.
Technically speaking, the Bitcoin daily chart displays a number of significant patterns that are coming together to point to a positive future.
Positioned within a well defined ascending channel that has directed price action since May, Bitcoin is now trading at $116,465.
According to the chart, Bitcoin has repeatedly tested and maintained the lower boundary of this channel, indicating robust institutional support in the $108,000–$111,000 range.
In August, Bitcoin consolidated and drew down to retest support after encountering resistance close to the first resistance objective, which is a normal and healthy price action in a bull market.
The channel’s recent recovery from its lower border raises the possibility that this downturn is finished.
The upper channel border aligns with the chart’s “Next target,” which is the $128,000–$132,000 region.
If Bitcoin can break over the initial resistance cluster, it might experience a 12–15% rebound from current levels. This target zone is a logical continuation of the current bull trend.
Disclaimer and Risk Warning
coinweck does not endorse or is responsible for any content, accuracy, quality, advertising, products, or other materials on this page. The image used in this article is for informational purposes only and is provided to us by a third party. coinweck should not be held responsible for image copyright issues. Contact us if you have any issues or concerns. Readers should do their research before taking any actions related to the company.