


Ethereum Price Outlook: After Cease-Fire, ETH Springs Bear Trap—Can It Reach $3,000?
Ethereum (ETH) has gone up by nearly 7% in the past 24 hours as trading volumes have jumped by 34% during this period.
This action, mainly initiated by a ceasefire between Israel and Iran mediated by President Donald Trump, resulted in the elimination of short positions valued at over $335 million.


ETH Short Liquidations Nearly Match Bitcoin’s as Bears Overextend
In a surprising turn, liquidated short positions in Ethereum (ETH) are nearly on par with those of Bitcoin (BTC), suggesting that bearish traders may have overreached during the weekend.
The past five days have seen heightened market volatility, following the U.S. bombing of three key nuclear research and enrichment sites within Iranian territory—marking its entry into a regional conflict.
Despite the turmoil, market sentiment has shown signs of recovery. The Fear and Greed Index rose from a fearful 37 to a more neutral 47 at the time of writing.
After reaching a peak in mid-June, open interest (OI) in ETH futures had been steadily declining. However, today’s price uptick appears to be reigniting trader interest—possibly signaling optimism for a continued uptrend fueled by the potential for a short squeeze.
ETH Eyes $3,000 but Must First Clear $2,750
On the daily chart, ETH has broken above its consolidation range, triggering a bear trap. To maintain momentum and approach the $3,000 mark, it must first decisively surpass the $2,750 resistance level.
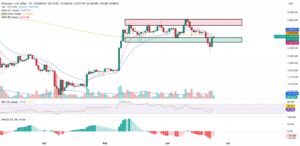

Traders who anticipated that escalating U.S.-Iran tensions might trigger a market collapse are now at risk, as ETH’s price could climb further, potentially hitting their stop-loss orders.
However, it’s still too early to confirm a trend reversal from bearish to bullish. At the moment, ETH remains below both its short-term and long-term exponential moving averages (EMAs), signaling ongoing downward pressure.
The Relative Strength Index (RSI) also hasn’t shown meaningful recovery, continuing to trade below its 14-day moving average. These technical indicators suggest that a clear shift in ETH’s trend has yet to materialize.
Key Resistance at $2,750
The $2,750 level is the key resistance to monitor. A decisive break above it would boost the likelihood of a rally toward $3,000, aligning with the target outlined in our previous Ethereum forecast.
Inverse Head and Shoulders Pattern Signals Potential Upside
On lower time frames, a possible inverse head and shoulders pattern is forming—typically a bullish signal. The neckline sits at $2,450. A breakout above this level would signal a potential uptrend, but a successful retest and bounce from this point would offer stronger confirmation of bullish momentum.
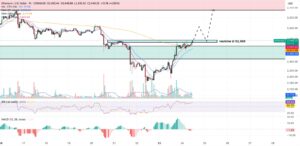
The Relative Strength Index (RSI) shows that positive momentum is strong in this lower time frame as it has reached overbought levels meaning that buyers have rushed to scoop up ETH tokens amid this shift in the geopolitical landscape.
If this breakout occurs, the first target to watch would be the $2,700 level, which is also the key resistance in the daily chart.
Disclaimer and Risk Warning
coinweck does not endorse or is responsible for any content, accuracy, quality, advertising, products, or other materials on this page. The image used in this article is for informational purposes only and is provided to us by a third party. coinweck should not be held responsible for image copyright issues. Contact us if you have any issues or concerns. Readers should do their research before taking any actions related to the company.