


Ethereum Price Prediction: As ETH contends with the $2,850 resistance, its futures open interest hits a record peak
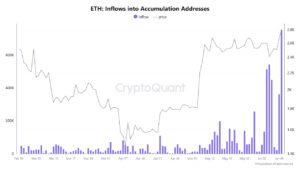
On Wednesday, Ethereum (ETH) momentarily surpassed $2,850 after its futures open interest (OI) reached a record high of 15.21 million ETH. In the past week, significant inflows into accumulation addresses have coincided with the increase in OI.
Ethereum’s open interest has reached unprecedented levels, with a notable spike in inflows to accumulation addresses.
Over the past three days, Ethereum has experienced a 12% increase, coinciding with a rise in its futures open interest that reached an unprecedented level of 15.21 million ETH after a rise of 1.57 million ETH. Funding rates have also experienced a minor increase alongside OI growth, suggesting that ETH investors are developing a greater appetite for risk.

Significantly, the Chicago Mercantile Exchange (CME) was responsible for most of the growth in ETH Open Interest (OI) among leading exchanges, with the Volatility Shares 2x leveraged ETH ETF (ETHU) being the main contributor to this increase. This demonstrates that institutional investors are the ones fueling the demand for leverage. A K33 Research report published on Tuesday indicated that from April 8 to June 9,
the ETH equivalent exposure of ETHU grew by 305,100 ETH, whereas the CME’s ETH OI increased by 295,250 ETH. To put it differently: Over the last two months, CME’s ETH OI would have dropped by 9,850 ETH if it weren’t for VolatilityShares. It is worrisome to observe that one entity is monopolizing such a large portion of the market on CME, and it comes from a bunch
of traders thirsting for leveraged long exposure in ETH,” the report states.
According to SoSoValue data, US spot Ethereum ETFs have experienced consistent buying pressure, with net inflows of $124.93 million on Tuesday and a positive streak extending for 17 consecutive days.
ETH accumulation addresses also show a similar bullish structure, with large inflows exceeding 400K ETH on five of the past seven days. Accumulation addresses refer to those that have not engaged in the sale or distribution of any tokens, with newly created addresses constituting the majority of these.
Meanwhile, according to Laevitas.ch data, ETH may experience heightened volatility with prices surpassing $2,800, as it has the second-highest volume and the third-largest open interest by strike price in the options market. If the underlying asset rises above its strike price, thereby enhancing the likelihood of profit-taking, an option contract is considered to be in the money or in profit.
Ethereum Price Forecast
According to Coinglass data, Ethereum experienced a total of $111.56 million in futures liquidations over the past 24 hours, with long liquidations amounting to $64.26 million and short liquidations totaling $47.29 million.
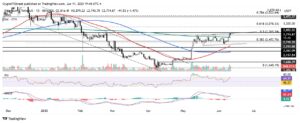
Ethereum briefly surpassed the $2,850 key resistance on Wednesday after flipping the upper boundary of a key channel, marking the first occurrence since February 4.
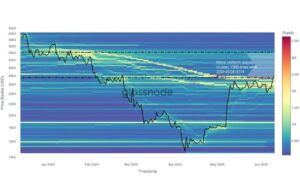
According to Glassnode data, the leading altcoin has surpassed the cost basis of approximately 2.1 million ETH acquired at around $2,700 – $2,760. ETH has no significant resistance until it nears the $3,400 mark. It is also in line with the cost basis being uniformly spread out until it nears $3,417.
Glassnode noted in a Wednesday X post, “If the $2.70K–$2.76K support range holds, the path to $3.42K remains technically open, but the speed of $ETH’s climb will depend on how holders respond in the $2.8K–$3.3K range.”
If ETH bounces back to the $2,850 level, it could face resistance around the 61.8% Fibonacci retracement at $3,078 in the near term. The ETH’s ascent beyond its 200-day Simple Moving Average (SMA) bolsters the upward momentum, as this movement frequently heralds a robust uptrend for the leading altcoin.
ETH might find support at the 200-day SMA if it holds the rejection at $2,850, but this is a downside scenario. If it drops below this level, ETH could head toward $2,500.
The Relative Strength Index (RSI) is probing the boundary of its overbought area. At the same time, the Moving Average Convergence Divergence (MACD) is trying to cross over its moving average line after its histogram turned positive. A crossover will bolster the bullish momentum.
Disclaimer and Risk Warning
coinweck does not endorse or is responsible for any content, accuracy, quality, advertising, products, or other materials on this page. The image used in this article is for informational purposes only and is provided to us by a third party. coinweck should not be held responsible for image copyright issues. Contact us if you have any issues or concerns. Readers should do their research before taking any actions related to the company.