

The top 3 Price predictions, XRP, BTC, and ETH, will consolidate their robust weekly gains.
As of Friday, the price of Bitcoin (BTC) has risen 9.5% so far this week and is now hovering at $93,000. Following Bitcoin’s lead, Ethereum (ETH) and Ripple (XRP) saw 10% and 5% increases, respectively. These coins’ momentum indicators, however, show indications of bullish exhaustion, pointing to a possible pullback in the days ahead.


Bitcoin bulls exhibit indications of fatigue.
The price of bitcoin rose 10.45% to close above $93,000 on Thursday after breaking above this resistance level on Monday. Bitcoin, however, was unable to close above its peak of $95,000 in March. As of Friday, it is trading close to $93,000 and is subject to a slight pullback.
Should Bitcoin continue to decrease, it may reach support at the psychological importance level of $90,000.
After being rejected on Thursday near its overbought level of 70, the Relative Strength Index (RSI) on the daily chart now reads 66, indicating waning bullish momentum. A significant drop in the price of Bitcoin may occur if the RSI drops below its neutral level of 50.

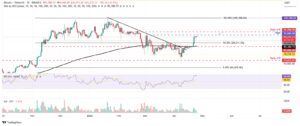
However, if BTC continues its upward momentum and closes above $95,000, it could extend the rally to retest its next daily resistance at $97,000.
The price of Ethereum encounters resistance at $1,861.
The price of Ethereum closed above the $1,700 resistance level on Tuesday after rising 11.19%. The following day, it gained more, peaking at $1,834, but was unable to close above its daily resistance level of $1,861. On Thursday, ETH saw a little decrease. As of this writing on Friday, it was still trading below $1,750.
ETH may extend the losses to retest its next daily support at $1,449 if it continues to decline and closes below $1,700.
Fading bullish momentum is indicated by the RSI on the daily chart, which is at 52 and points lower toward its neutral level of 50. Ethereum’s price may drop precipitously if the RSI drops below its neutral threshold of 50.
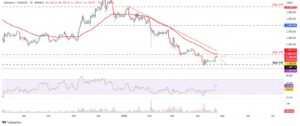
On the other hand, if ETH finds support around $1,700, it could extend the rally to retest its daily resistance at $1,861
XRP drops after being rejected by its main resistance levels.
The price of XRP fell a little the next day after failing to close above the daily resistance level at $2.23 on Wednesday. This daily level was a crucial resistance zone since it aligned with the 50-day Exponential Moving Average at $2.19. When this article was written on Friday, XRP was trading at about $2.17.
XRP may continue to fall and retest its next support level at $1.96 if it keeps correcting.
The daily chart’s RSI is 52, and similar to Ethereum, it indicates waning positive momentum as it points lower toward its neutral level of 50. The price of XRP may drop precipitously if the RSI drops below its neutral threshold of 50.
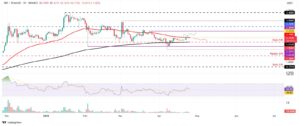
However, if XRP closes above its daily resistance level of $2.23, it will extend the rally to retest its March 24 high of $2.50 before potentially reaching $3.00.
coinweck does not endorse or is responsible for any content, accuracy, quality, advertising, products, or other materials on this page. The image used in this article is for informational purposes only and is provided to us by a third party. coinweck should not be held responsible for image copyright issues. Contact us if you have any issues or concerns. Readers should do their research before taking any actions related to the company.