


XRP Traders Eye Bollinger Band Shift $2.70 or Crash to $1.70?
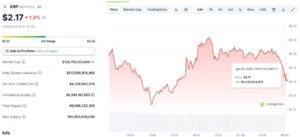
After weeks of sideways consolidation, the fourth-largest cryptocurrency appears to be nearing a crucial decision point at this time, based on a new review of XRP Bollinger Bands forecast patterns. XRP is currently trading at about $2.17, which is directly between some significant critical levels that will likely determine whether prices will soon rise to $2.70 or maybe drop to $1.70.
XRP Price Targets and Bollinger Band Volatility Risks
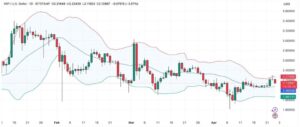
A narrower band pattern that typically precedes significant price changes in cryptocurrency markets can be seen when examining the current XRP Traders Eye Bollinger Band price prediction data. The XRP price is somewhat trapped between the higher band, which is around $2.27, and the lower band, which is around $1.86, according to this intriguing technical setup. The middle band, which is essentially a 20-day moving average, is currently acting as an immediate support level for traders at $2.06.
Target Price for Bullish XRP: $2.70 Resistance
According to the most recent XRP Bollinger Bands prediction models, the bullish XRP price goal is located at the resistance level of about $2.70. If the price can hold onto support at the middle band ($2.06), there is a significant possibility that this scenario will come to pass. A rally toward the key $2.70 level could be triggered by a successful break over that challenging $2.27 level. Based on recent months’ XRP volatility forecast patterns, this price analysis displays many prior support and resistance zones that appear to validate this target.
Bearish Outlook: $1.70 XRP Support
However, if the present $2.06 support doesn’t hold in the upcoming days, the price of XRP may undoubtedly decline. The lower band at $1.86 seems to be the first crucial support level, according to recent XRP Bollinger Bands prediction indicators, with $1.70 designated as the second significant level to keep an eye on. This relatively pessimistic ripple price analysis scenario would undoubtedly be strengthened by many successive daily closes below the lower band.
The current trading volume, which is over $4.2 billion over the last 24 hours, indicates that both traders and investors are participating in the market to a considerable extent.
Market Background for Technical Analysis of XRP
When examining the larger market background for XRP technical analysis, it’s important to remember that, before settling into its present trading range, XRP moved from about $0.50 to above $3.40 over the previous year. According to the data from the crypto technical analysis, Bollinger Band compression usually occurs before notable volatility. Currently, a lot of traders are aggressively setting themselves up for either situation as XRP keeps consolidating around the $2.17 mark.
The current band arrangement unquestionably points to an impending market volatility expansion, and some technical experts who accurately forecasted the spectacular XRP rise from $0.50 to $3.40 are still cautiously optimistic about the XRP price projections for 2025.
For both short-term traders and long-term investors who are keeping a close eye on Ripple price analysis reports for potential trading opportunities in this erratic cryptocurrency market, the present XRP Bollinger Bands prediction situation is still crucial.
Disclaimer and Risk Warning
coinweck does not endorse or is responsible for any content, accuracy, quality, advertising, products, or other materials on this page. The image used in this article is for informational purposes only and is provided to us by a third party. coinweck should not be held responsible for image copyright issues. Contact us if you have any issues or concerns. Readers should do their research before taking any actions related to the company.