Forecast for Ripple Price: Bullish breakout indicated by XRP’s NUPL and SOPR
On Thursday, Ripple (XRP) maintained support at $3.00, indicating signs of recovery. Over the previous few days, interest in the cross-border money remittance token has remained stable, supported by the futures weighted funding rate increasing from 0.0018% on Tuesday to 0.0090%.
The growing funding rate will support optimistic market sentiment as traders take on more long positions in XRP, raising the likelihood of a short-term bullish breakout.

XRP consolidates as on-chain metrics signal breakout
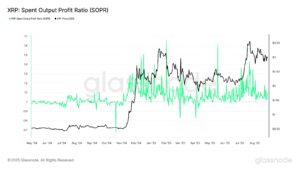
Following widespread profit-taking after the price reached a new record high of $3.66 on July 18, the XRP Spent Output Profit Ratio (SOPR) measure has been gradually declining toward a ratio of 1 over the past few weeks.
“The realized value (USD) divided by the value at creation (USD) of the output” is how Glassnode defines SOPR. This statistic, to put it simply, shows the value of the amount paid divided by the price sold.
For holders of spent XRP tokens, a SOPR above 1 indicates a profit at the moment of the transaction, whereas a measure below 1 indicates a loss.
When the SOPR is less than 1, investors would rather stay onto their investments than sell when they are profitable. Investors are hesitant to sell given the current SOPR of 1.09, perhaps in anticipation of a price recovery for XRP over the $3.00 short-term support.

Likewise, the Net Unrealized Profit/Loss (NUPL) is currently at 0.54 and is steadily approaching the crucial 0.50 mark. The amount of XRP that is in profit or loss at any one time, and to what degree, is known as NUPL.
The cycle may have a local bottom if the NUPL value is close to 0.5. In anticipation of a short-term bullish breakthrough, investors will probably expand their exposure by taking advantage of the cooling of the XRP price from its all-time high.
Technical outlook: XRP bulls target 12% breakout
The price of XRP is now consolidating at about $3.00 in anticipation of a possible breakout. On the 4-hour chart, the 50-period Exponential Moving Average (EMA) supports the short-term bullish mood at $2.95.
Market hesitancy is indicated by the Relative Strength Index (RSI), which is presently drifting below the median at 48. To determine the strength of the upswing, traders will examine the RSI’s return above the midline.
The push and pull between the bulls and bears, however, may continue longer than anticipated because the Moving Average Convergence Divergence (MACD) indicator is currently falling below the mean line.
To strengthen the bullish hold, traders will wait for the blue MACD line to cross above the red signal line, which is the expected breakout. If market conditions change and XRP accelerates the slide below the 50-period EMA at $2.95, traders should pay particular attention to the 100-period EMA at $2.76 and the next resistance at $3.35, which was challenged on August 15.
Disclaimer and Risk Warning
coinweck does not endorse or is responsible for any content, accuracy, quality, advertising, products, or other materials on this page. The image used in this article is for informational purposes only and is provided to us by a third party. coinweck should not be held responsible for image copyright issues. Contact us if you have any issues or concerns. Readers should do their research before taking any actions related to the company.


