


Price of Bitcoin: $85K Turns Ahead for Weekend Fireworks
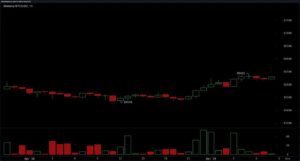
The price of bitcoin rose sharply from $84,310 to $85,432 on the 1-hour chart before settling into a brief consolidation at $84,739, which is slightly above the 61.8% Fibonacci retracement. Market depth revealed that short-term momentum cooled without collapsing and bids thickened close to that golden ratio level, suggesting that traders would reload longs if bitcoin retests the $84,700–$84,900 pocket with little sell volume. While a decline below $84,300 would prompt inquiries about deeper support, a clear hourly close over $85,400 would accelerate a drive above the week’s $86,000 liquidity node.
Price of bitcoin
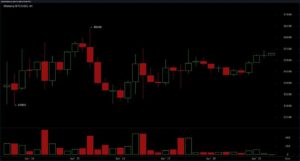
When zoomed out to the 4 hours, Bitcoin has seen a limited range of higher lows after recovering from $83,031, with sellers capping gains at $86,450. Instead of depletion, accumulation is suggested by this sideways-to-up channel. Both rallies and pullbacks are accompanied by volume spikes, which show balanced two-way interest. The bias switches toward testing the upper barrier if the midpoint at $85,000 is maintained. A clean breakout would project to the late-March swing high at $88,000. However, if $83,000 is not defended, the price will probably move closer to the $80,000 psychological shelf that traders observed last month.
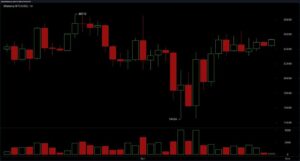
Following April’s decline to $74,434, the daily chart depicts a more comprehensive recovery story. Since then, Bitcoin has recovered more than half of that decline and is currently teetering on the 23.6% retracement around $85,388—a level that frequently determines whether relief rallies turn into new explosive gains. Strong dip demand was highlighted by the bullish engulfing candle that was produced close to the bottom, and follow-through purchasing has maintained the market on track to return to the $88,772 annual top. However, if macro headwinds materialize, traders will target $81,603, the 50% daily retracement, as crucial support.
Equilibrium is mostly reflected in oscillator readings. The metrics that indicate neutrality rather than trend exhaustion include the relative strength index (RSI) at 53, the stochastic oscillator at 87, the commodities channel index (CCI) at 81, the average directional index (ADX) at 13, and the awesome oscillator at 1,045. When the moving average convergence divergence (MACD) prints a positive 45, it indicates a modest bullish tilt, but momentum (MOM) at 2,720 flashes a sell bias, suggesting waning upside speed. The mixed picture suggests patience: traders can hold off on taking a high-conviction position until either the MACD fades or the MOM reverts.
Although they are not absolute, moving-average (MA) measures tend to be constructive. Between $82,799 and $83,973, the short-term exponential moving average (EMA 10 / 20 / 30) and simple moving average (SMA 10 / 20 / 30) cluster, each displaying optimism and acting as a buffer below the spot price. The SMA 50 at $84,221 provides intermediate support, while the EMA 50 at $85,327 gives a negative signal, suggesting that bitcoin needs to overcome that obstacle decisively to open the way toward $88,000.
The EMA 200 at $85,008 returns to the positive area, while the EMA 100 and SMA 100, which are at $87,414 and $91,061, respectively, are still in bearish territory. For early trend confirmation, traders should thus keep an eye out for any crossings between the EMA 50 and EMA 200.
Two areas of tactical importance are formed by the convergence of Fibonacci retracement grids over the three time periods. On the micro side, $84,337 to $84,871—a probable reload area for dip buyers—is framed by overlapping 50–61.8% bars on the 1- and 4-hour charts. On the macro canvas, the psychologically powerful $80,000 handle and the 61.8% level at $79,911 line up with the daily 50% mark at $81,603, creating an appealing swing-entry basin in the event of a deeper decline. On the other hand, breaking through the daily 23.6% line at $85,388 would initiate a technical glide path that would go to $88,772, the final obstacle before entering unexplored territory.
Bull Verdict:
Bitcoin’s price may rise toward the $88,000 swing high and possibly even beyond if it maintains the $84,300–$85,000 cushion and records a distinct hourly close over $85,400.
Bear’s Decision:
With $74,434 standing as the final significant support, a clear break below $83,000 would tip the scales in favor of sellers and invite a drift to the 50% daily retracement at $81,603 and maybe the 61.8 percent barrier near $79,900.
Disclaimer and Risk Warning
coinweck does not endorse or is responsible for any content, accuracy, quality, advertising, products, or other materials on this page. The image used in this article is for informational purposes only and is provided to us by a third party. coinweck should not be held responsible for image copyright issues. Contact us if you have any issues or concerns. Readers should do their research before taking any actions related to the company.